

HDPE Pipe Flow Rate Chart: Bore and Capacity by OD and SDR
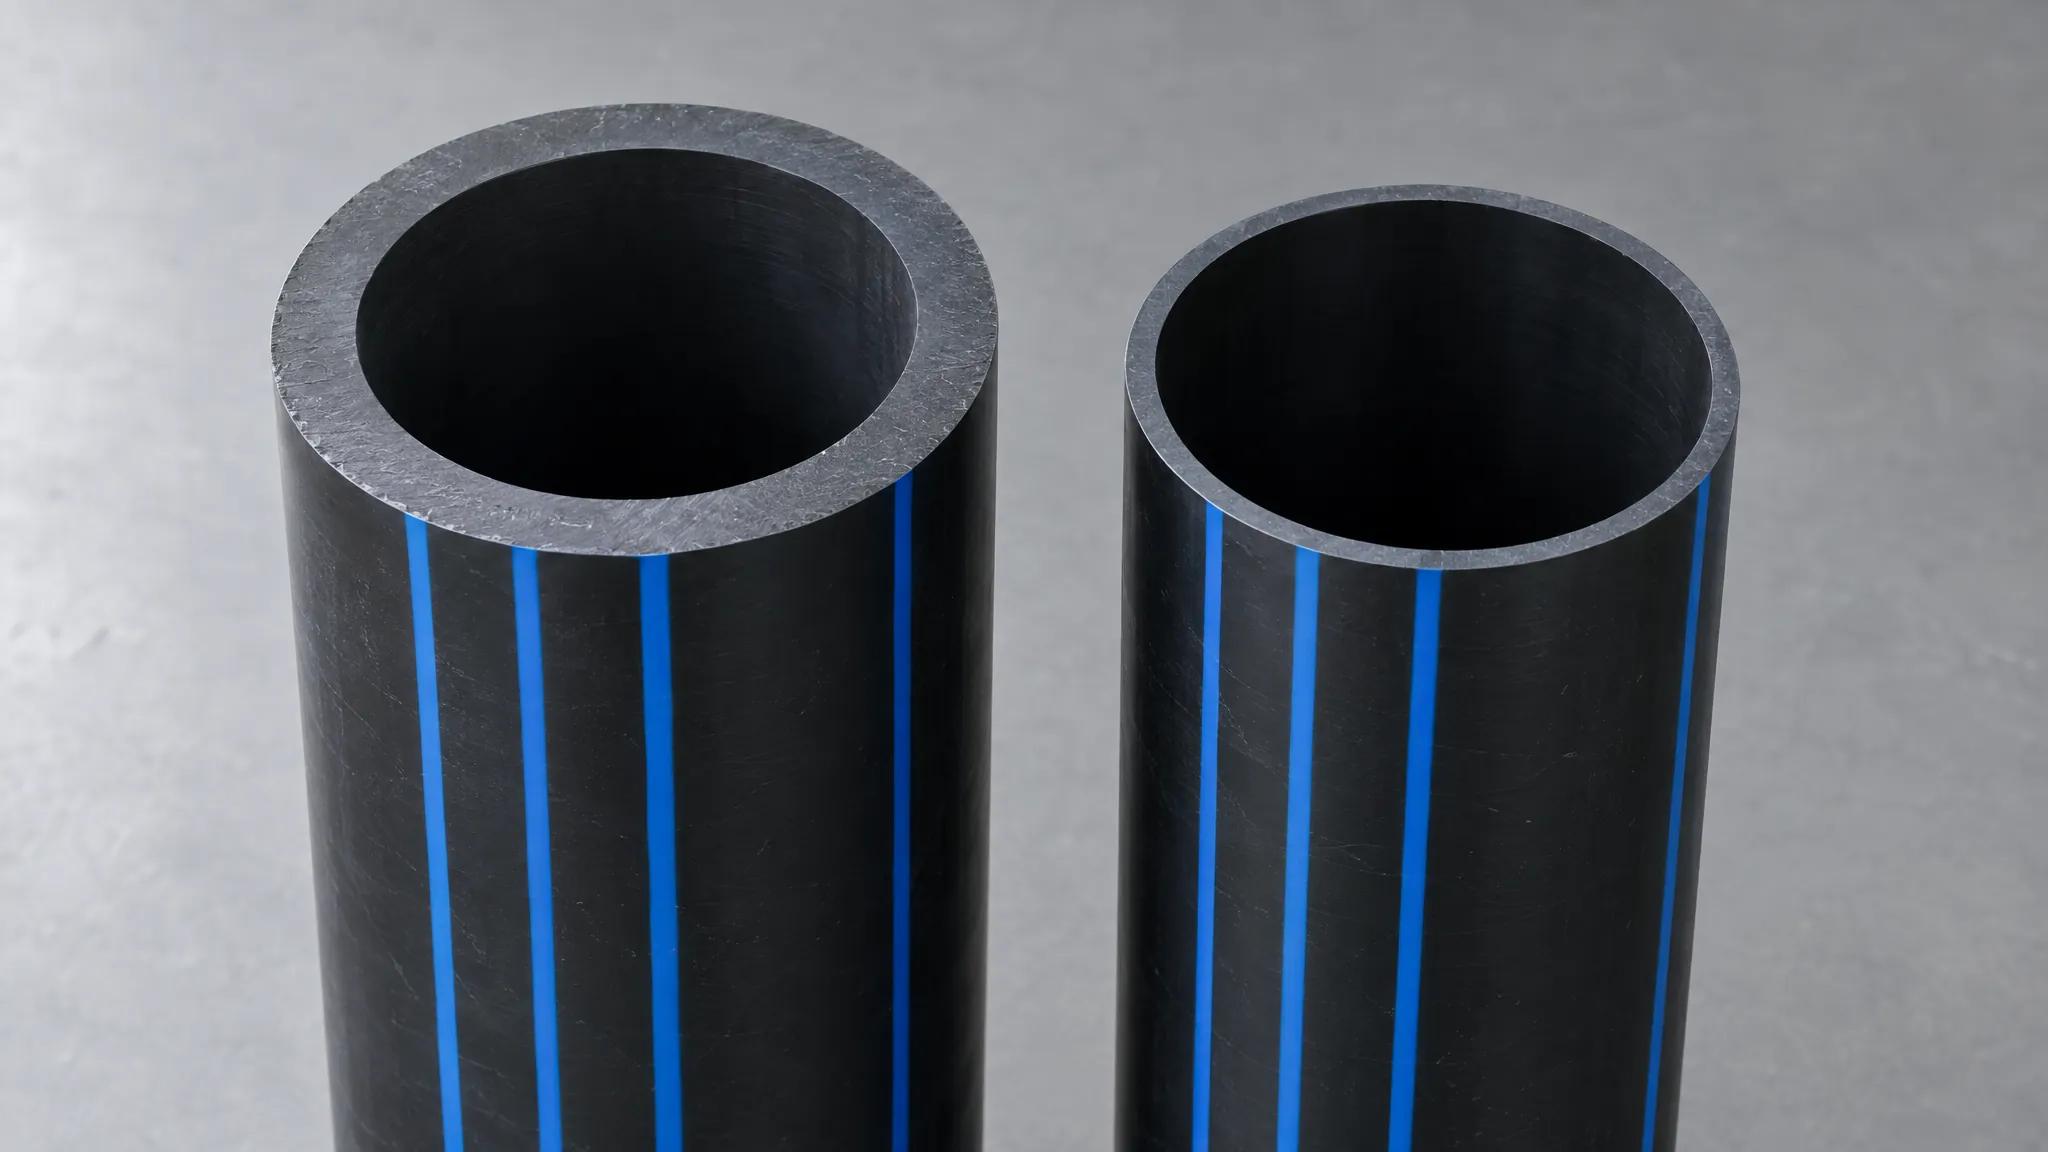
HDPE flow rate and velocity table in L/s and m3/h, with bores from ISO 4427-2 by OD and SDR, plus head loss two ways and the surge limit per SDR.
A DN110 PE 100 pipe in SDR 11 has a bore of 90.0 mm and carries 6.36 litres per second at a mean velocity of 1.0 m/s, or 12.72 L/s at 2.0 m/s. The same DN110 in SDR 17 has a 96.8 mm bore and carries 7.36 L/s and 14.72 L/s at those velocities. That is the whole calculation: take the nominal outside diameter, subtract twice the wall thickness that ISO 4427-2 assigns to the SDR, and multiply the bore area by the velocity you are willing to run.
The tables below do that for every common size from DN20 to DN400 in SDR 11, 17, 21 and 26, in litres per second and cubic metres per hour. Head loss per 100 m is computed two ways, so you can see how far the two standard methods disagree on the same pipe. One finding is worth knowing before you start: the velocity a flow table lets you pick is already limited by the SDR printed in the same row, and the thinner the wall, the tighter that limit gets.
Key Takeaways
- Flow capacity follows the bore, and the bore follows the SDR: DN110 gives 90.0 mm in SDR 11 and 101.6 mm in SDR 26, a 27 per cent gain in flow area for the same outside diameter.
- Dividing dn by the SDR does not reproduce the wall thickness ISO 4427-2 actually tabulates. At DN110 SDR 17 the shortcut gives 6.47 mm against a tabulated 6.6 mm.
- Hazen-Williams at C = 150 and Darcy-Weisbach do not agree, and the sign of the disagreement flips with bore: 6.6 per cent low at DN20, 6.6 per cent high at DN400.
- PPI’s allowable sudden velocity change falls as the wall thins: 2.13 m/s in SDR 11 but only 1.52 m/s in SDR 21. A 2.0 m/s design is comfortable in one and outside the allowance in the other.
- Every figure here is a design value derived from a published standard or formula. None of it is a measurement of any particular pipe.
On this page
- The Bore Is the Number, Not the OD
- Flow Capacity of PE 100 SDR 11, by Outside Diameter
- The Same Sizes in SDR 17, SDR 21 and SDR 26
- Head Loss: Hazen-Williams at C = 150 Against Darcy-Weisbach
- The SDR in the Row Already Limits the Velocity in the Row
- Sizing a 1.2 km Rising Main From the Table Alone
- What to Write on the Drawing and in the BOQ
- Where This Table Stops Being Right
- Frequently Asked Questions

The Bore Is the Number, Not the OD
PE pressure pipe is called out by its outside diameter. A DN110 pipe is 110 mm across the outside and stays 110 mm across the outside in every pressure class, which is what makes butt fusion and electrofusion work across the range. What changes with pressure class is the wall, and the wall is what the water never sees.
ISO 4427-2:2019 Table 2 assigns a minimum wall thickness to each combination of nominal size and SDR. Subtract twice that wall from the outside diameter and you have the bore the hydraulics run on. At DN110 that gives 90.0 mm in SDR 11, 93.8 mm in SDR 13.6, 96.8 mm in SDR 17, 99.4 mm in SDR 21 and 101.6 mm in SDR 26 — a 27 per cent spread in flow area across one outside diameter.
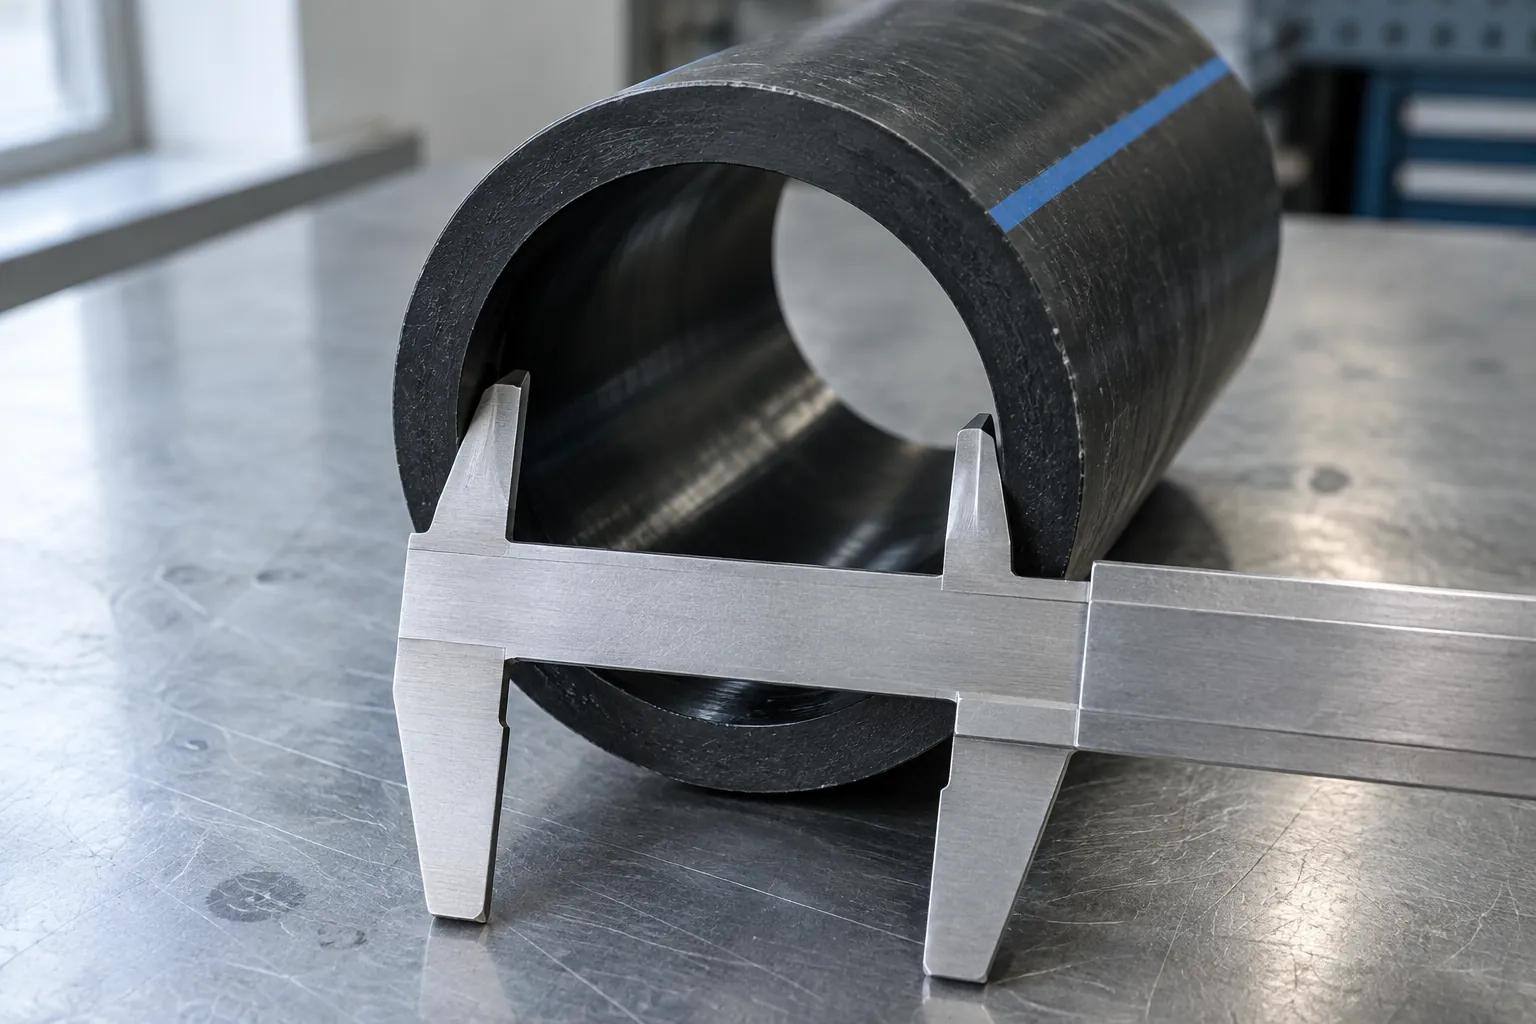
A shortcut circulates that you can divide the outside diameter by the SDR and get the wall. It is close and it is wrong. ISO 4065 defines SDR as only approximately the ratio of nominal outside diameter to nominal wall thickness, and the wall thicknesses in ISO 4427-2 come from a standardised table rather than from that division. At DN110 SDR 17 the arithmetic returns 6.47 mm while the standard tabulates 6.6 mm. That 0.13 mm becomes 0.26 mm of bore and 0.54 per cent of flow area.
What makes the shortcut worse than a small fixed error is that it is not fixed. In the SDR 17 column it costs 0.68 per cent at DN63 and 0.25 per cent at DN160, and at DN110 SDR 11 the division lands exactly on the tabulated wall and costs nothing. A spreadsheet built on it is wrong by a different amount in every row.
Small sizes carry a second correction. ISO 4427-2 rounds the calculated minimum wall up to the nearest of 2.0, 2.3 or 3.0 mm to satisfy national requirements, and recommends 3.0 mm where the pipe will be electrofusion jointed or lined. That is why DN20 in SDR 11 carries 2.0 mm rather than the 1.82 mm the ratio implies, and why a small SDR 11 line has less bore than its class suggests. Full outside-diameter and wall-thickness figures sit in the HDPE pipe size and SDR chart; this page starts where that one stops.
The nominal outside diameter is also the lower bound of the tolerance band in ISO 4427-2 Table 1 rather than its middle: a conforming DN110 pipe measures 110.0 to 110.7 mm. The bore you receive is a band, not a number.
Flow Capacity of PE 100 SDR 11, by Outside Diameter
SDR 11 is PN 16 in PE 100 and the class most distribution and pumped work lands on. Read across to the velocity you can accept, or down until the flow column reaches your duty.
| Nominal size DN/OD (mm) | Minimum wall (mm) | Bore (mm) | Flow at 1.0 m/s (litres per second) | Flow at 2.0 m/s (litres per second) |
|---|---|---|---|---|
| 20 | 2.0 | 16.0 | 0.20 | 0.40 |
| 25 | 2.3 | 20.4 | 0.33 | 0.65 |
| 32 | 3.0 | 26.0 | 0.53 | 1.06 |
| 40 | 3.7 | 32.6 | 0.83 | 1.67 |
| 50 | 4.6 | 40.8 | 1.31 | 2.61 |
| 63 | 5.8 | 51.4 | 2.07 | 4.15 |
| 75 | 6.8 | 61.4 | 2.96 | 5.92 |
| 90 | 8.2 | 73.6 | 4.25 | 8.51 |
| 110 | 10.0 | 90.0 | 6.36 | 12.72 |
| 125 | 11.4 | 102.2 | 8.20 | 16.41 |
| 160 | 14.6 | 130.8 | 13.44 | 26.87 |
| 200 | 18.2 | 163.6 | 21.02 | 42.04 |
| 250 | 22.7 | 204.6 | 32.88 | 65.76 |
| 315 | 28.6 | 257.8 | 52.20 | 104.40 |
| 400 | 36.3 | 327.4 | 84.19 | 168.37 |
Source: minimum wall thicknesses from ISO 4427-2 Table 2; bore and flow computed as ID = dn − 2e and Q = π/4 × ID² × v. Derived design values, not measurements.
Capacity climbs with the square of the bore, so the steps between sizes are larger than they look. DN110 to DN160 is a 45 per cent jump in outside diameter and a 111 per cent jump in capacity: 6.36 L/s becomes 13.44 L/s at the same 1.0 m/s. Multiply any litres-per-second figure by 3.6 for cubic metres per hour, the unit most pump schedules use: DN110 SDR 11 at 1.5 m/s carries 34.35 m³/h against DN160’s 72.56 m³/h.
The chart below plots the same relationship as a line per bore. Each line is straight because flow is the product of a fixed area and the velocity, and the slope of the line is the flow area itself.
| Mean velocity (m/s) | DN63 SDR 11 (bore 51.4 mm) | DN110 SDR 11 (bore 90.0 mm) | DN160 SDR 11 (bore 130.8 mm) | DN250 SDR 11 (bore 204.6 mm) |
|---|---|---|---|---|
| 0.5 | 1.04 | 3.18 | 6.72 | 16.44 |
| 1.0 | 2.07 | 6.36 | 13.44 | 32.88 |
| 1.5 | 3.11 | 9.54 | 20.16 | 49.32 |
| 2.0 | 4.15 | 12.72 | 26.87 | 65.76 |
| 2.5 | 5.19 | 15.9 | 33.59 | 82.19 |
| 3.0 | 6.22 | 19.09 | 40.31 | 98.63 |
The Same Sizes in SDR 17, SDR 21 and SDR 26
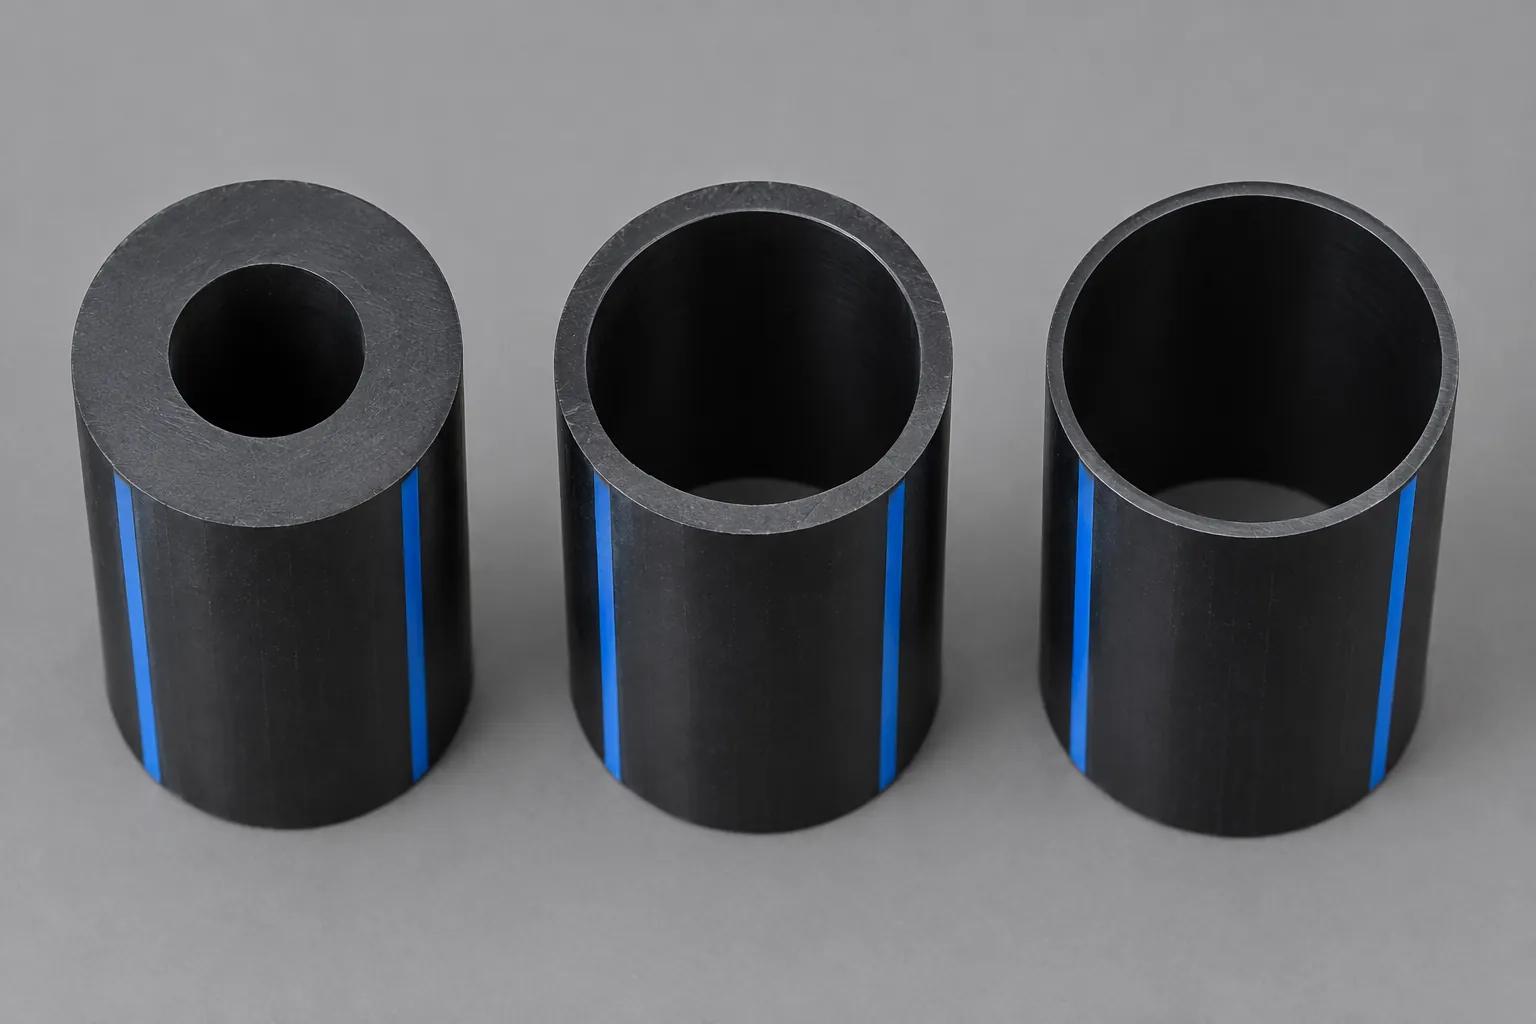
Dropping a pressure class thins the wall and widens the bore without changing the outside diameter, the fittings or the fusion equipment. In PE 100 the ladder runs SDR 11 at PN 16, SDR 13.6 at PN 12.5, SDR 17 at PN 10, SDR 21 at PN 8 and SDR 26 at PN 6. SDR 17 is the workhorse for buried mains that never see more than 10 bar.
| Nominal size DN/OD (mm) | Minimum wall (mm) | Bore (mm) | Flow at 1.0 m/s (litres per second) | Flow at 2.0 m/s (litres per second) |
|---|---|---|---|---|
| 32 | 2.0 | 28.0 | 0.62 | 1.23 |
| 40 | 2.4 | 35.2 | 0.97 | 1.95 |
| 50 | 3.0 | 44.0 | 1.52 | 3.04 |
| 63 | 3.8 | 55.4 | 2.41 | 4.82 |
| 75 | 4.5 | 66.0 | 3.42 | 6.84 |
| 90 | 5.4 | 79.2 | 4.93 | 9.85 |
| 110 | 6.6 | 96.8 | 7.36 | 14.72 |
| 125 | 7.4 | 110.2 | 9.54 | 19.08 |
| 160 | 9.5 | 141.0 | 15.61 | 31.23 |
| 200 | 11.9 | 176.2 | 24.38 | 48.77 |
| 250 | 14.8 | 220.4 | 38.15 | 76.30 |
| 315 | 18.7 | 277.6 | 60.52 | 121.05 |
| 400 | 23.7 | 352.6 | 97.65 | 195.29 |
Source: minimum wall thicknesses from ISO 4427-2 Table 2; bore and flow computed as ID = dn − 2e and Q = π/4 × ID² × v. Derived design values, not measurements.
Against SDR 11, SDR 17 buys between 15 and 17 per cent more flow at the same velocity across the range: 7.36 L/s instead of 6.36 L/s at DN110, and 97.65 L/s instead of 84.19 L/s at DN400, both at 1.0 m/s. It also removes 34 per cent of the wall, and with it a large part of the resin the pipe is priced on.
| Nominal size (mm) | SDR 21 bore (mm) | SDR 21 flow (litres per second) | SDR 26 bore (mm) | SDR 26 flow (litres per second) |
|---|---|---|---|---|
| 50 | 45.2 | 2.41 | 46.0 | 2.49 |
| 63 | 57.0 | 3.83 | 58.0 | 3.96 |
| 75 | 67.8 | 5.42 | 69.2 | 5.64 |
| 90 | 81.4 | 7.81 | 83.0 | 8.12 |
| 110 | 99.4 | 11.64 | 101.6 | 12.16 |
| 125 | 113.0 | 15.04 | 115.4 | 15.69 |
| 160 | 144.6 | 24.63 | 147.6 | 25.67 |
| 200 | 180.8 | 38.51 | 184.6 | 40.15 |
| 250 | 226.2 | 60.28 | 230.8 | 62.76 |
| 315 | 285.0 | 95.69 | 290.8 | 99.63 |
| 400 | 361.8 | 154.21 | 369.4 | 160.76 |
Source: minimum wall thicknesses from ISO 4427-2 Table 2; bore and flow computed as ID = dn − 2e and Q = π/4 × ID² × v. Derived design values, not measurements.
The step from SDR 21 to SDR 26 is the smallest on the ladder. At DN110 it adds 2.2 mm of bore and 4.5 per cent of capacity, from 11.64 to 12.16 L/s at 1.5 m/s, while dropping the class from PN 8 to PN 6 and tightening the surge allowance by roughly 10 per cent. Rarely worth it on a pumped line.
Head Loss: Hazen-Williams at C = 150 Against Darcy-Weisbach
A flow table tells you what fits through the pipe and nothing about what the run costs in pressure, which on a long line is the number that sizes the pump. Two methods are in general use and are usually presented as interchangeable. On PE pipe they are not.
The PPI Handbook of PE Pipe records the Hazen-Williams friction factor for PE as C = 150 to 155, determined in a hydraulics laboratory on heat-fusion-joined lengths with the internal bead left in place. That last detail matters, because the bead is the usual explanation offered when a field line underperforms a textbook figure, and in this coefficient it is already accounted for. The tables here take the conservative end of the range, C = 150. It is a design coefficient chosen for calculation, not a measured property of any particular pipe.
| Nominal size (mm) | Bore (mm) | Flow (litres per second) | Hazen-Williams C = 150 (m/100 m) | Darcy-Weisbach (m/100 m) |
|---|---|---|---|---|
| 25 | 20.4 | 0.49 | 12.61 | 13.27 |
| 40 | 32.6 | 1.25 | 7.30 | 7.45 |
| 50 | 40.8 | 1.96 | 5.62 | 5.66 |
| 63 | 51.4 | 3.11 | 4.29 | 4.28 |
| 90 | 73.6 | 6.38 | 2.83 | 2.77 |
| 110 | 90.0 | 9.54 | 2.23 | 2.17 |
| 160 | 130.8 | 20.16 | 1.45 | 1.39 |
| 200 | 163.6 | 31.53 | 1.11 | 1.06 |
| 250 | 204.6 | 49.32 | 0.86 | 0.81 |
| 315 | 257.8 | 78.30 | 0.66 | 0.62 |
| 400 | 327.4 | 126.28 | 0.50 | 0.47 |
Source: head loss computed from the bores above. Hazen-Williams at C = 150 (PPI, Handbook of PE Pipe, 2nd ed., Ch. 6); Darcy-Weisbach with Colebrook-White at ε = 0.0015 mm (same source, Table 2-1), water at 20 °C. Straight pipe, no fittings.
Run the two methods side by side and they cross. In small pipe Hazen-Williams predicts less head loss than Darcy-Weisbach: 6.6 per cent less at DN20, 4.9 per cent less at DN25, 2.0 per cent less at DN40. The gap closes around a bore of 45 to 51 mm, somewhere between DN50 and DN63 in SDR 11, and then reverses. At DN200 Hazen-Williams predicts 5.0 per cent more head loss and at DN400 it predicts 6.6 per cent more.
| Mean velocity (m/s) | Hazen-Williams, C = 150 (m per 100 m) | Darcy-Weisbach (m per 100 m) |
|---|---|---|
| 0.5 | 0.29 | 0.3 |
| 0.75 | 0.62 | 0.63 |
| 1.0 | 1.05 | 1.05 |
| 1.25 | 1.59 | 1.56 |
| 1.5 | 2.23 | 2.17 |
| 2.0 | 3.81 | 3.65 |
| 2.5 | 5.76 | 5.47 |
| 3.0 | 8.07 | 7.61 |
The reason is structural. Hazen-Williams fixes the velocity exponent at 1.852 and folds everything else into one coefficient, while Darcy-Weisbach carries a friction factor that falls as the Reynolds number rises. The divergence also widens with velocity at a fixed bore.
| Mean velocity (m/s) | Flow (litres per second) | Hazen-Williams (m/100 m) | Darcy-Weisbach (m/100 m) | Difference (%) |
|---|---|---|---|---|
| 0.5 | 3.18 | 0.29 | 0.30 | -3.9 |
| 1.0 | 6.36 | 1.05 | 1.05 | +0.7 |
| 1.5 | 9.54 | 2.23 | 2.17 | +2.9 |
| 2.0 | 12.72 | 3.81 | 3.65 | +4.3 |
| 2.5 | 15.90 | 5.76 | 5.47 | +5.3 |
| 3.0 | 19.09 | 8.07 | 7.61 | +6.0 |
Source: head loss computed from the bores above. Hazen-Williams at C = 150 (PPI, Handbook of PE Pipe, 2nd ed., Ch. 6); Darcy-Weisbach with Colebrook-White at ε = 0.0015 mm (same source, Table 2-1), water at 20 °C. Straight pipe, no fittings.
Neither column is wrong, and the gap stays under about seven per cent across the whole range shown, which is smaller than the margin most designers already carry for fittings. Use whichever the specification names. The one case where the choice does matter is temperature. PPI notes that Hazen-Williams carries no term for water viscosity, so its error grows away from about 16 °C, and on a hot-climate buried main that is a limitation of the method rather than a rounding question.
The SDR in the Row Already Limits the Velocity in the Row
Pick a velocity from a flow table and you have made a surge decision without being told. When a valve closes or a pump trips, the pressure rise a PE line sees is proportional to how much velocity was lost, and the allowance for that rise is set by the pipe’s own pressure class. PPI tabulates the sudden velocity change a PE pressure pipe can absorb before its static rating has to be lowered, and the allowance shrinks as the wall thins.
| SDR and PE 100 class | Recurring surge limit (m/s) | Occasional surge limit (m/s) | Verdict for a 2.0 m/s design |
|---|---|---|---|
| SDR 26, PN 6 | 1.37 | 2.74 | Over the limit; slow down or thicken the wall |
| SDR 21, PN 8 | 1.52 | 3.05 | Over the limit; slow down or thicken the wall |
| SDR 17, PN 10 | 1.71 | 3.41 | Over the limit; slow down or thicken the wall |
| SDR 13.5 / 13.6, PN 12.5 | 1.89 | 3.78 | Over the limit; slow down or thicken the wall |
| SDR 11, PN 16 | 2.13 | 4.27 | Inside the recurring allowance |
| SDR 9, PN 20 | 2.35 | 4.69 | Inside the recurring allowance |
Source: PPI, Handbook of PE Pipe, 2nd ed., Ch. 6, Table 1-3A, converted from ft/s at 0.3048 m/ft. These figures are for PE4710 and PE3710 to the AWWA C906 family, not a provision of ISO 4427.
Read the last column against Table 1 and the trap is obvious. A DN160 SDR 21 line sized at 2.0 m/s carries 32.8 L/s and looks efficient, and it sits 0.48 m/s above the recurring allowance for its own wall. The same 2.0 m/s in SDR 11 sits comfortably inside a 2.13 m/s allowance. The thin pipe that gave you extra bore for free gave back a slower ceiling, and nothing in a flow chart says so.
| SDR (dn/e, both in mm) | Allowable sudden velocity change (m/s) |
|---|---|
| 7.3 | 2.65 |
| 9 | 2.35 |
| 11 | 2.13 |
| 13.5 | 1.89 |
| 17 | 1.71 |
| 21 | 1.52 |
| 26 | 1.37 |
| 32.5 | 1.22 |
Two scope limits belong with those numbers: they are PPI figures for PE4710 and PE3710 to the AWWA C906 family rather than a provision of ISO 4427, and they describe a sudden change. Where one will exceed the allowance, the remedy is a slower closing regime or a working pressure rating below the static one.
| Velocity band (m/s) | Head loss at DN110 SDR 11 (m/100 m) | Best for |
|---|---|---|
| 0.5 to 0.9 | 0.30 to 0.87 | Gravity feed and long transmission runs where pumping head is the cost |
| 1.0 to 1.5 | 1.05 to 2.17 | Distribution mains and rising mains; the normal working band |
| 1.6 to 2.0 | 2.44 to 3.65 | Short pumped legs and irrigation submains where head is cheap |
| 2.1 to 3.0 | 3.99 to 7.61 | Temporary, bypass and wash-out duty only |
Source: head loss computed from the bores above. Hazen-Williams at C = 150 (PPI, Handbook of PE Pipe, 2nd ed., Ch. 6); Darcy-Weisbach with Colebrook-White at ε = 0.0015 mm (same source, Table 2-1), water at 20 °C. Straight pipe, no fittings.
Sizing a 1.2 km Rising Main From the Table Alone
A borehole scheme has to deliver 30 L/s to a tank 1,200 m away. Three candidates come out of the tables above, and the first one is the one most people pick.
DN160 SDR 11 has a 130.8 mm bore. Table 1 shows 13.44 L/s at 1.0 m/s, so 30 L/s needs 2.23 m/s. Head loss at that velocity works out at 3.02 m per 100 m by Hazen-Williams, which is 36.2 m of friction head over the full run. Then Table 6 kills it: 2.23 m/s exceeds the 2.13 m/s recurring surge allowance for SDR 11. The size that looked tight on pressure was already outside its own surge envelope.
DN200 SDR 11 has a 163.6 mm bore and carries the same 30 L/s at 1.43 m/s. Friction head falls to 1.02 m per 100 m, or 12.2 m over 1,200 m, and the velocity sits well inside the allowance. One size up removed 24 m of pump head.
DN200 SDR 17 has a 176.2 mm bore and moves 30 L/s at 1.23 m/s for 0.71 m per 100 m, which is 8.5 m over the run and sits inside a 1.71 m/s allowance. Against the first candidate that is a 76 per cent cut in friction head, from a pipe with 34 per cent less wall in it. Whether it is the right answer turns on one question, which is whether PN 10 covers the static head plus the surge the scheme can generate. With the tank 60 m above the borehole it does not, and the choice is DN200 in SDR 11.
The order of the checks is what makes this work: duty flow, bore, head loss over the real run length, velocity against its own surge allowance, and only then pressure class against static head. Skip the fourth check and the scheme passes design review and fails on a valve.
For a contractor or procurement buyer working from a takeoff: send the dn, SDR and lengths with your enquiry.
What to Write on the Drawing and in the BOQ
A sized line becomes a comparable quote only if the line item names the same four things every supplier reads the same way. Those are the product standard and its edition, the PE grade, the nominal outside diameter, and the SDR with the pressure class it implies. Written out, a DN200 line reads: pipe to ISO 4427-2:2019, PE 100, DN200, SDR 17, PN 10.
Quoting a bore instead is the fastest way to get three quotes you cannot compare. Ask for “200 mm pipe” and one supplier prices SDR 11 at a 163.6 mm bore while another prices SDR 17 at 176.2 mm. The SDR is the price, and it has to be in the line item.
The edition belongs in the line item too. ISO 4427-2:2019 is the second edition and carries Amendment 1:2023, which replaced the DN 1 000 row of the wall-thickness table and left the rest unchanged. A specification reading only “to ISO 4427” lets the supplier work to whatever edition sits in their file.
The last item is the check on delivery. ISO 4427-2 requires the pipe itself to carry the standard number, the nominal size, the SDR or series, the material designation and the pressure class, so a delivery can be verified against the line item at the truck rather than at the trench. Check the class you wrote against the product catalogue before the line item leaves your desk, and read the marking convention in the PN versus SDR versus schedule explainer.
Where This Table Stops Being Right
Every figure above is a design value with an assumption sitting under it. Four of them move real projects.
The bores are minimum-wall bores, and the wall tolerance runs to roughly 10 per cent plus 0.1 mm. At DN110 SDR 11 that is up to 1.1 mm of extra wall and 2.2 mm off the bore, which costs about 4.8 per cent of flow area. On a duty sized with no margin, that is the margin.
The head-loss figures are straight-pipe figures. Bends, tees, valves and reducers add equivalent length that this table does not carry, and on a short run with many fittings the fittings can exceed the pipe. On the 1,200 m rising main above they are a rounding error; on a 40 m plant room they are the calculation.
Water at 20 °C is the reference. Hazen-Williams carries no viscosity term at all, so its error grows in both directions away from about 16 °C, and the Darcy-Weisbach column shifts with the Reynolds number as temperature moves. A buried main in the Sahel and one in a highland scheme are not running the same fluid.
And C = 150 describes new, clean, fusion-jointed pipe. PE does not tuberculate the way unlined iron does, which is why it holds its coefficient for decades, but scale, biofilm and silt from an unscreened source all lower it. On raw or borehole water, take the margin in the coefficient rather than in the diameter.
Conclusion
Sizing a PE line takes four numbers and they all sit on this page: the bore from ISO 4427-2, the flow at a velocity you choose, the head loss over the run, and the surge allowance the SDR you picked will tolerate. The fourth is the one that gets skipped, and it is the one that turns a design review pass into a field failure.
Before asking a supplier to price the line, take the four items a quotation request needs: the product standard and edition, the PE grade, the nominal outside diameter, and the SDR with its pressure class. Sending those instead of a bore is what makes three quotes comparable.
Frequently Asked Questions
How do I calculate the flow rate of an HDPE pipe?
Work out the bore first: take the nominal outside diameter and subtract twice the minimum wall thickness that ISO 4427-2 Table 2 gives for that size and SDR. Then multiply the bore area, π/4 × ID², by the mean velocity. A DN110 SDR 11 pipe has a 90.0 mm bore and an area of 6,362 mm², so at 1.5 m/s it carries 9.54 litres per second, or 34.35 m³/h.
What is the inside diameter of DN110 HDPE pipe?
It depends on the SDR, because the outside diameter is fixed and the wall is not. In PE 100 the DN110 bore is 90.0 mm in SDR 11 (PN 16), 93.8 mm in SDR 13.6, 96.8 mm in SDR 17 (PN 10), 99.4 mm in SDR 21 and 101.6 mm in SDR 26. All five are the same 110 mm pipe on the outside.
What velocity should I design an HDPE water main for?
Most distribution and rising mains land between 1.0 and 1.5 m/s, where head loss at DN110 SDR 11 runs 1.05 to 2.17 m per 100 m. The ceiling is not a general rule but a function of the SDR: PPI gives the allowable sudden velocity change as 2.13 m/s for SDR 11 and 1.52 m/s for SDR 21, and a design velocity above that figure leaves the pipe with no surge headroom.
Should I use Hazen-Williams or Darcy-Weisbach for PE pipe?
Use whichever the specification asks for, and know the gap. At C = 150 Hazen-Williams predicts up to 6.6 per cent less head loss than Darcy-Weisbach in small bore and up to 6.6 per cent more in large bore, with the crossover near a 45 to 51 mm bore. Darcy-Weisbach is the better choice where water temperature is far from 16 °C, because Hazen-Williams carries no viscosity term.
Does a higher SDR mean more flow?
Yes, for the same nominal size, because a higher SDR is a thinner wall and a wider bore. DN110 gains 27 per cent of flow area going from SDR 11 to SDR 26. It also drops from PN 16 to PN 6 and its allowable sudden velocity change falls from 2.13 to 1.37 m/s, so the extra capacity comes with a lower pressure and surge ceiling.
How do I convert litres per second to cubic metres per hour?
Multiply by 3.6. DN160 SDR 11 at 1.5 m/s carries 20.16 L/s, which is 72.56 m³/h. To go the other way, divide the cubic-metres-per-hour figure by 3.6.
Related Briefings
HDPE Pipe Color Code: What It Means, Region by Region
uPVC Pressure Pipe Class B, C, D and E: What the BS 3505 Classes Mean in East and West African Tenders, and How They Map to PN