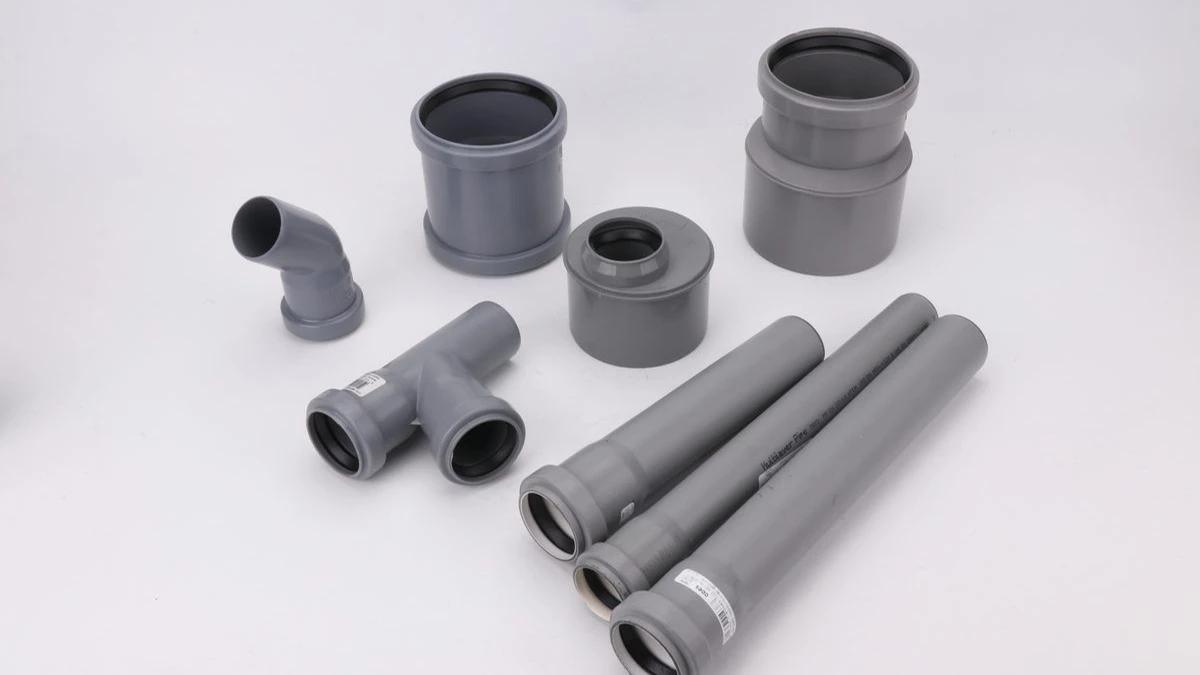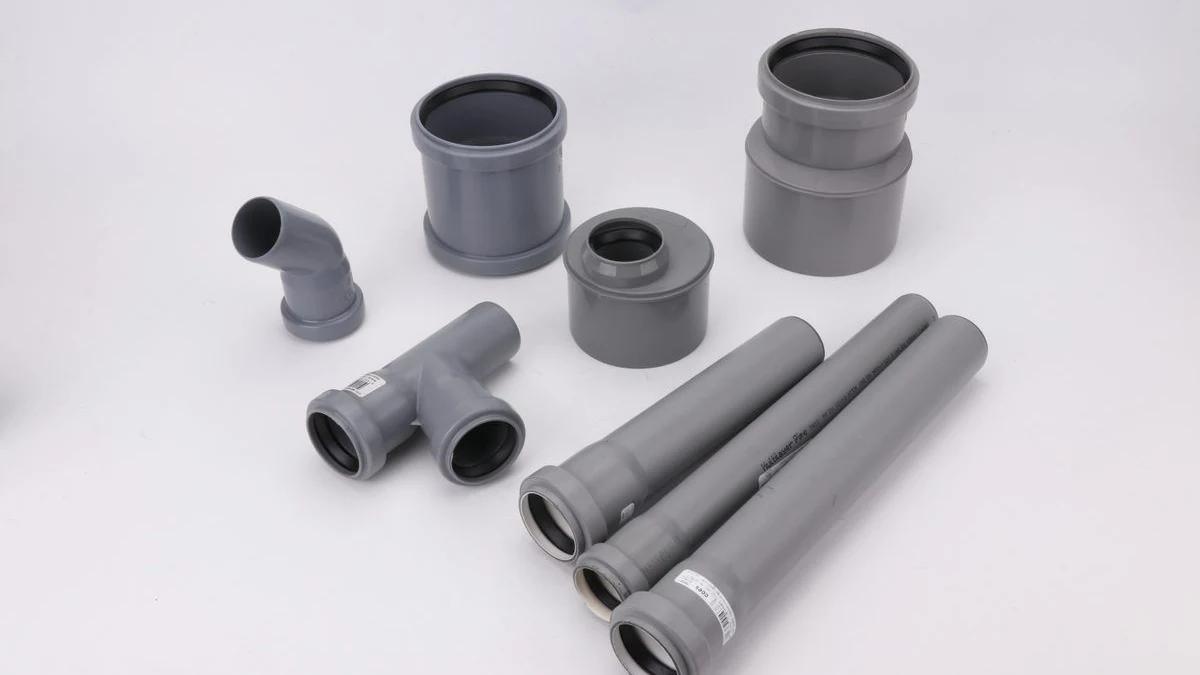

Gráfico de perda de carga por atrito em tubo PPR: perda de carga por 100 m por SDR
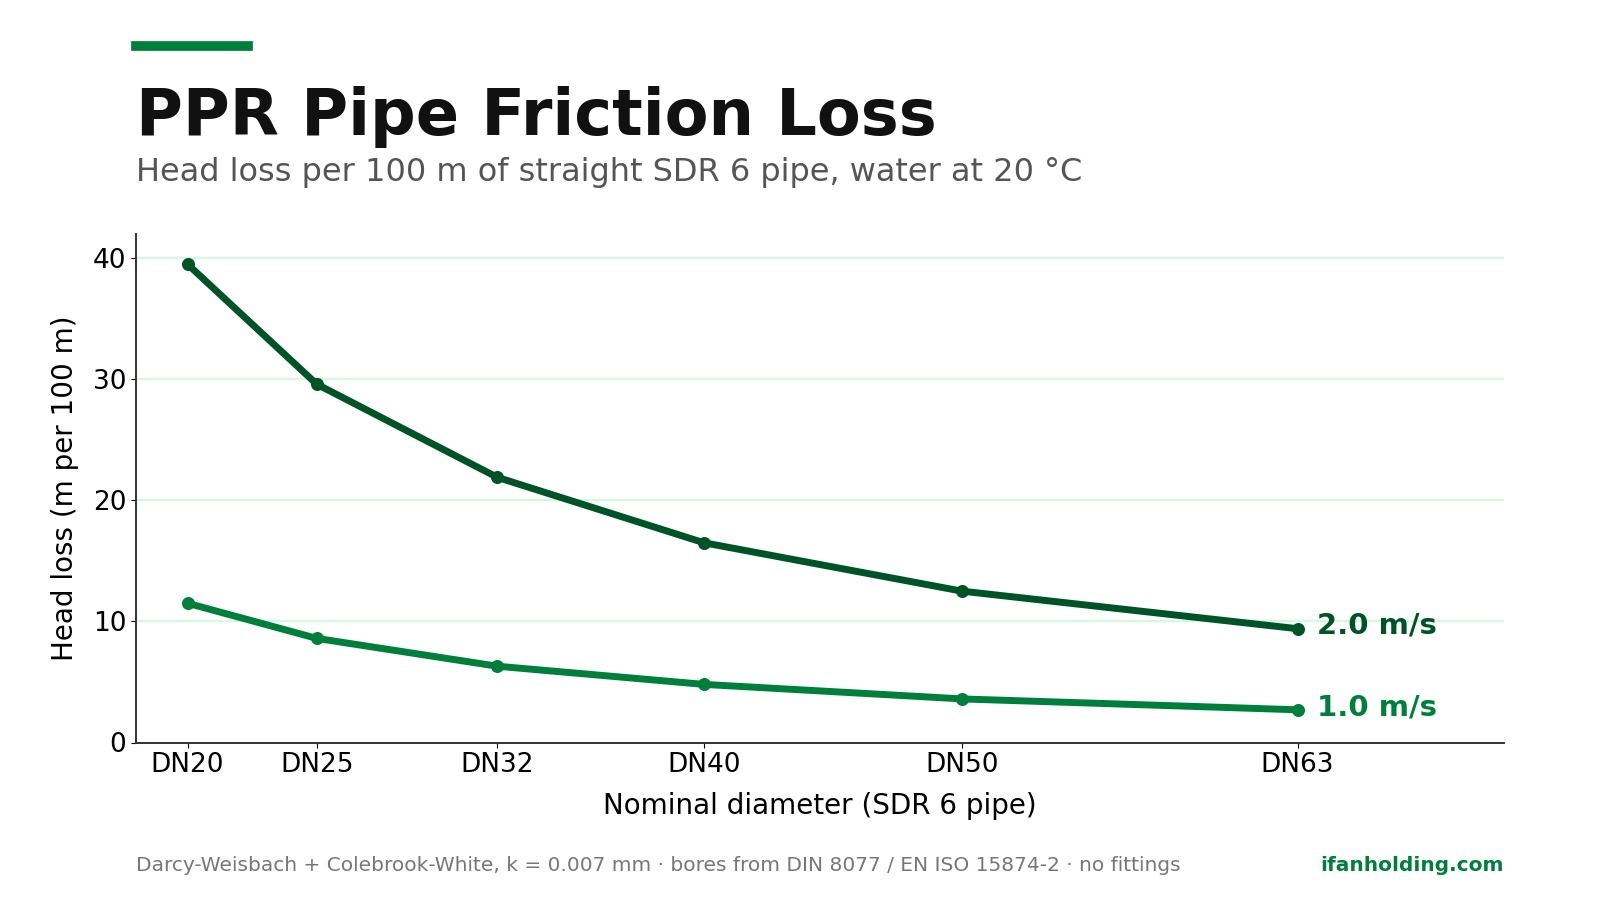
Gráfico de perda de carga em PPR em m por 100 m a caudais reais, calculado com Darcy-Weisbach a k=0,007 mm e indicado por SDR, diâmetro interno e temperatura da água.
Em tubo PP-R SDR 6 a transportar água a 20 °C, um metro por segundo de velocidade custa cerca de 11,5 m de perda de carga por 100 m em DN20, 8,6 em DN25, 6,3 em DN32, 4,8 em DN40, 3,6 em DN50 e 2,7 em DN63. O gráfico completo, com caudais e velocidades, apresenta-se abaixo.
Segue-se uma segunda tabela porque aqueles seis valores não valem nada por si sós. A perda de carga é determinada pelo diâmetro interior, o diâmetro interior pela série de parede, e a designação PN na sua cotação não indica a série de forma fiável. Todos os gráficos de atrito PPR gratuitos na primeira página omitem a série, a temperatura da água e a rugosidade. Esta página apresenta as três.
Pontos-chave
- O gráfico é indexado por SDR, não por PN, porque PN não é uma dimensão. Com DE 20 mm, um catálogo designa a parede de 2,8 mm como PN20 e a parede de 3,4 mm como PN25; a nossa própria tabela de dimensões designa a parede de 2,8 mm como PN16 e a parede de 3,4 mm como PN20. Verifique a parede em milímetros.
- O diâmetro interior decide tudo. Com DE 25 mm, o diâmetro interior é 16,6 mm em SDR 6 e 20,4 mm em SDR 11, e o mesmo caudal perde então 8,6 contra 3,2 m por 100 m.
- A água quente perde menos, não mais: 0,86 vezes o valor a 20 °C a 60 °C, para o mesmo caudal.
- Calculado com Darcy-Weisbach e Colebrook-White a k = 0,007 mm. Apenas tubo reto, sem acessórios, sem altura estática, paredes verificadas até DE 63 mm.
Um apontamento antes dos números. O Practical Engineering faz passar água por uma instalação física e aborda o termo do diâmetro aos 5:15 — repare quanto a queda de pressão varia com um degrau de dimensão, porque esse efeito representa a maior parte do que o gráfico abaixo mede.

Flow and Pressure in Pipes Explained, Practical Engineering — um canal de engenharia independente, não um fornecedor de tubos. A sua demonstração utiliza Hazen-Williams; esta página calcula com Darcy-Weisbach, pela razão indicada abaixo.
Tabela de perda de carga em PPR: tubo SDR 6, água a 20 °C
Os pontos de caudal situam-se em 0,5, 1,0 e 2,0 m/s, em vez de litros por segundo arredondados, pelo que a tabela serve também de verificação de velocidade. DN25 a 0,216 L/s corresponde a 1,0 m/s e 8,6 m por 100 m; a 0,433 L/s está a 2,0 m/s e 29,6 m por 100 m, ponto em que a maioria dos projetistas aumenta o diâmetro.
| DN (mm) | Vazão (L/s, ×3,6 = m3/h) | Velocidade (m/s) | Perda de carga (m/100 m) | Veredito de projeto |
|---|---|---|---|---|
| DN20 | 0,068 | 0,50 | 3,4 | Velocidade baixa, silencioso, superdimensionado para a vazão |
| DN20 | 0,137 | 1,00 | 11,5 | Ponto de projeto normal para uma prumada de distribuição |
| DN20 | 0,274 | 2,00 | 39,5 | Acima do limite usual de 2 m/s para ruído e erosão |
| DN25 | 0,108 | 0,50 | 2,5 | Velocidade baixa, silencioso, superdimensionado para a vazão |
| DN25 | 0,216 | 1,00 | 8,6 | Ponto de projeto normal para uma prumada de distribuição |
| DN25 | 0,433 | 2,00 | 29,6 | Acima do limite usual de 2 m/s para ruído e erosão |
| DN32 | 0,176 | 0,50 | 1,9 | Velocidade baixa, silencioso, superdimensionado para a vazão |
| DN32 | 0,353 | 1,00 | 6,3 | Ponto de projeto normal para uma prumada de distribuição |
| DN32 | 0,706 | 2,00 | 21,9 | Acima do limite usual de 2 m/s para ruído e erosão |
| DN40 | 0,278 | 0,50 | 1,4 | Velocidade baixa, silencioso, superdimensionado para a vazão |
| DN40 | 0,556 | 1,00 | 4,8 | Ponto de projeto normal para uma prumada de distribuição |
| DN40 | 1,111 | 2,00 | 16,5 | Acima do limite usual de 2 m/s para ruído e erosão |
| DN50 | 0,438 | 0,50 | 1,0 | Velocidade baixa, silencioso, superdimensionado para a vazão |
| DN50 | 0,876 | 1,00 | 3,6 | Ponto de projeto normal para uma prumada de distribuição |
| DN50 | 1,752 | 2,00 | 12,5 | Acima do limite usual de 2 m/s para ruído e erosão |
| DN63 | 0,693 | 0,50 | 0,8 | Velocidade baixa, silencioso, superdimensionado para a vazão |
| DN63 | 1,385 | 1,00 | 2,7 | Ponto de projeto normal para uma prumada de distribuição |
| DN63 | 2,771 | 2,00 | 9,4 | Acima do limite usual de 2 m/s para ruído e erosão |
Leia a tabela por SDR, não pela designação PN da fatura
O SDR 6 é o mais pesado das três séries de água mais comuns, pelo que apresenta o menor diâmetro interior para um dado diâmetro exterior.
| OD (mm) | ID a SDR 11 (mm) | ID a SDR 7,4 (mm) | ID a SDR 6 (mm) |
|---|---|---|---|
| DN20 | 16,2 | 14,4 | 13,2 |
| DN25 | 20,4 | 18,0 | 16,6 |
| DN32 | 26,2 | 23,2 | 21,2 |
| DN40 | 32,6 | 29,0 | 26,6 |
| DN50 | 40,8 | 36,2 | 33,4 |
| DN63 | 51,4 | 45,8 | 42,0 |
Baseie a tabela no SDR porque o PN não é uma dimensão. As normas dimensionais, DIN 8077 e EN ISO 15874-2, tabelam a espessura de parede por série de tubo e não indicam qualquer classe de pressão. A ISO 4065:2018 fixa a geometria no ponto 3.6 como S = (SDR − 1) / 2, e depois define a designação no ponto 4.2 como S = tensão de cálculo / PN. A parede é normalizada; a classe que lhe corresponde não o é, porque a tensão de cálculo pertence ao composto e à temperatura e vida útil de projeto. Faça as contas: S 2,5, que é SDR 6, é PN20 com uma tensão de cálculo de 5,0 MPa e PN25 com 6,25 MPa. Mesmo tubo, mesmo diâmetro interior, duas designações corretas.
É por isso que as tabelas publicadas divergem e nenhuma delas está errada. Um catálogo de PP-R indica PN25 = SDR 6, PN20 = SDR 7,4, PN16 = SDR 9, PN10 = SDR 11, e a tabela de um segundo fornecedor apresenta a mesma escala. A nossa tabela de dimensões e classes de pressão de PPR avança um passo: PN12,5, PN16, PN20, PN25 contra SDR 11, 7,4, 6, 5. Assim, uma linha PN20 com OD 20 mm corresponde a uma parede de 2,8 mm numa convenção e de 3,4 mm na outra, ou seja, um diâmetro interior de 14,4 contra 13,2 mm. Leia a linha SDR 6 mantendo a parede mais leve e sobrestima a perda de carga em cerca de 52%.
Por isso, encomende por espessura de parede em milímetros ou por série S, nunca apenas pelo número PN. PN versus SDR versus schedule aborda os três sistemas de classificação, e a página do fornecedor de PPR apresenta a gama que temos disponível.
Como os Números Foram Produzidos e Como Reproduzi-los
Darcy-Weisbach com fator de atrito de Colebrook-White, não Hazen-Williams, cujo valor de C as fontes publicadas situam entre 145 e 150 para plástico, sem nada que indique qual está correto. Colebrook usa uma rugosidade absoluta em milímetros, e o PP-R tem uma publicada: 0,007 mm, o valor que as tabelas hidráulicas dos fabricantes utilizam, a 20 °C declarados.
Calcule uma célula à mão. O DN25 em SDR 6 tem um diâmetro interno de 16,6 mm, portanto a área é 2,1642 × 10⁻⁴ m². A 0,25 L/s a velocidade é 1,155 m/s e o número de Reynolds é 1,155 × 0,0166 / 1,0035 × 10⁻⁶, ou 19.108. A rugosidade relativa é 0,007 / 16,6, isto é, 4,217 × 10-4. Resolvendo Colebrook iterativamente obtém-se um fator de atrito de 0,02706, e a perda de carga é 0,02706 × 1,155² / (2 × 9,81 × 0,0166), que é 0,1108 m por metro, ou 11,1 m por 100 m. Aplique esses cálculos a qualquer célula da tabela e deverá chegar ao valor impresso.
Correção para Água Quente e para Parede Mais Fina
A correção de temperatura é contraintuitiva. A água quente é menos viscosa, o número de Reynolds sobe, o fator de atrito cai e o mesmo caudal custa menos perda de carga. De 20 a 60 °C, a viscosidade cinemática cai de 1,0035 para 0,4740 × 10⁻⁶ m²/s e a perda de carga cai para 0,86 do valor do ábaco. Uma coluna montante quente é um problema de classe de pressão, que a desclassificação de pressão em função da temperatura de serviço governa.
| Alteração | Multiplicar a perda de carga por | Porquê |
|---|---|---|
| Água a 40 °C em vez de 20 °C | × 0,91 | A viscosidade cai mais depressa do que o fator de atrito sobe |
| Água a 60 °C em vez de 20 °C | × 0,86 | Mesmo efeito, maior: uma linha quente perde menos do que uma fria |
| SDR 7,4 em vez de SDR 6, mesmo DN | × 0,66 | O diâmetro interior cresce 8,4% em DN25, de 16,6 para 18,0 mm |
| SDR 11 em vez de SDR 6, mesmo DN | × 0,37 | O diâmetro interior cresce 22,9% em DN25, de 16,6 para 20,4 mm |
A correção de série é maior. Uma parede mais leve é um diâmetro interior maior, pelo que, com o mesmo caudal, o SDR 11 em DN25 perde 3,2 m por 100 m contra os 8,6 do SDR 6. Esse ganho paga-se em classe de pressão: escolher SDR 11 para poupar altura de bombagem num circuito a 70 °C é como um sistema falha prematuramente.
O que a tabela não inclui
Apenas tubo reto. Curvas, tês e válvulas introduzem perdas localizadas para as quais não se apresenta aqui um comprimento equivalente, porque nenhum foi verificado contra um coeficiente de perda de PP-R publicado. A altura estática também está ausente: uma coluna de água acrescenta 1 m de altura, 0,098 bar, por metro de elevação, e pertence ao cálculo da coluna montante.
Montar um total de sistema não exige mais dados, apenas a definição. Altura total = (J / 100) × comprimento reto em metros, mais o somatório de ζ × v² / 2g sobre cada acessório e válvula, mais a elevação estática. J e v são retirados da linha que se lê; g é 9,81 m/s². O único termo que esta página não pode fornecer é ζ: obtenha-o junto do fabricante do acessório para o modelo exato, porque uma curva de encaixe PP-R, um tê moldado e um acessório de compressão do mesmo tamanho nominal não partilham o mesmo coeficiente. Peça por escrito em vez de recorrer a uma tabela de acessórios de aço.
Uma advertência antes de comparar esta tabela com um catálogo. Em três linhas amostradas de uma tabela hidráulica de PP-R publicada, com a mesma rugosidade e temperatura indicadas, as velocidades coincidiram até três casas decimais enquanto a perda de carga tabelada se situava cerca de 1,10 vezes mais alta. O catálogo não indica porquê. A IFAN não publica tolerância de diâmetro interior medida nem dados de bancada de caudal para o seu próprio tubo, pelo que todos os números aqui apresentados são calculados, não medidos.
Conclusão
Dois números decidem um cálculo de perda de carga em PPR e apenas um deles consta na sua cotação. O caudal você conhece; o diâmetro interno é preciso determinar, porque o mesmo tamanho nominal abrange 16,6 a 20,4 mm em DN25, o que representa um fator de 2,7 na perda de carga. Confirme a série de espessura de parede em milímetros e depois consulte a linha correspondente.
Perguntas Frequentes
Quanta perda de carga o tubo PPR apresenta por 100 m?
Em tubo SDR 6 a 20 °C e 1 m/s: 11,5 m por 100 m em DN20, 8,6 em DN25, 6,3 em DN32, 4,8 em DN40, 3,6 em DN50 e 2,7 em DN63. Reduzindo a velocidade à metade, a perda cai cerca de 3,4 vezes.
Qual fórmula devo usar para a perda de carga em PPR?
Darcy-Weisbach com fator de atrito de Colebrook-White. Ela considera uma rugosidade absoluta, que para o PP-R é publicada como 0,007 mm, de modo que o resultado é reprodutível. Hazen-Williams exige um valor de C sobre o qual as fontes publicadas divergem.
A água quente aumenta a perda de carga por atrito no tubo PPR?
Não. Na mesma vazão volumétrica, a perda de carga cai cerca de 14% ao passar de 20 °C para 60 °C, um fator de 0,86, porque a viscosidade cinemática cai de 1,0035 para 0,4740 × 10⁻⁶ m²/s. As prumadas de água quente falham por classe de pressão e dilatação, não por atrito.
Por que a série de parede altera a perda de carga por atrito?
Porque altera o diâmetro interno. Com DE 25 mm, o diâmetro interno é 16,6 mm em SDR 6 e 20,4 mm em SDR 11. Na mesma vazão, o tubo de parede mais espessa perde cerca de 2,7 vezes mais carga.
SDR 6 é o mesmo que PN20?
Não de forma confiável. A ISO 4065 define S = tensão de projeto / PN, de modo que a mesma parede recebe uma designação PN diferente em cada composto. Um catálogo chama SDR 6 de PN25; nossa própria tabela de dimensões chama de PN20. Compre por parede em milímetros ou por série S.
Com que velocidade devo dimensionar o tubo PPR?
A maioria dos projetistas mantém as prumadas de distribuição próximas de 1 m/s e trata 2 m/s como o limite para ruído e erosão. A tabela indica a velocidade ao lado de cada vazão, de modo que o limite fica visível.
Esta tabela inclui curvas, tês e válvulas?
Não, apenas tubo reto. As perdas localizadas em conexões e válvulas estão excluídas, e não se oferece comprimento equivalente porque nenhum foi verificado contra um coeficiente de perda de PP-R publicado.